Monday, November 19, 2012

Authorization Trace in SAP


Tracing Authorization Issue in SAP:


Identity Management and Data Security are very important concepts to be dealt within SAP to restrict users from accessing confidential information within the system. SAP being the global ERP system in most of the clients, its very important to make sure that proper authorizations are provided to each user. For EX, person working in the sales team should or may not be provided authorizations to be able to access Financial related transactions. SAP has provided some good options to restrict users from accessing information in any possible ways.

However, one of the most common issue we see is even the correct person missing necessary authorizations. Like, a manufacturing person working on the shop floor might be missing authorization to access a custom transaction dealing with Operations for that Production Order. The purpose of this Blog is to help either a functional or a technical SAP guy to identify the authorization object which is missing due to which user is not able to access the transaction.

Authorization Error Analysis Transaction: SU53

SU53 - In my experience, I can definitely say that this is one of the very important and useful transaction for any person working on SAP system.

To restrict users from accessing a transaction, we use a concept called Authorization object whereas only the users having that authorization object in their profile will be able to access the transaction which checks that Authorization object.

When you run a transaction in SAP, you might see a message as 'You Are Not Authorized' or 'No Authoration' etc, next step you would need to do is go to transaction SU53 where is shows the name of the authorization object which has failed. If you are eligible you can just request for that authorization object to be added to your profile. 

Not just with custom transactions, sap standard transactions also use the same concept, and this method helps you to identify the necessary authorization objects which needs to be added to your profile to get access to that transaction.

Another important point is, even if there is no Error Message on the screen if you feel that some thing is weird, as soon as you run the transaction you can check SU53 if any authorization object is failed. Like, there is SAP standard transaction which should show a button to DELETE a row, now we can restrict the visibility of that button using Authorzation-Object concept. In this case, program will not show any error message, the output is that the user will not be seeing that button. So if you feel that some buttons or some thing is missing when you access a particular transaction, check SU53 immediately to see as what is the issue.

Below screen shot shows a sneak peak of SU53. In that screen shot, S_USER_PRO is the authorization object for which the check has failed.
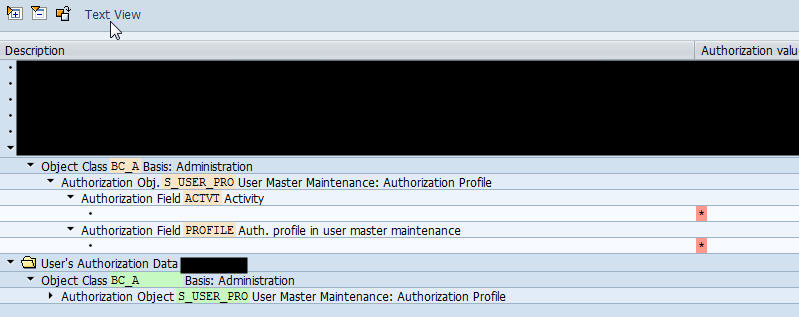


This SU53 can be used even to check authorization issues of other users using the Other Object button(3rd from left) on the screen shot above.

System Trace: - Using ST01

This is another way of tracing an authorization error.

You can use system trace function in transaction ST01 to trace authorization error when a transaction is being ran in an external session but on the same application server.

For EX: I have a webdynpro application which might have given some error message on the screen. For this SU53 may not work all the times( as the application is being ran on a browser), for which we can use the above method. Another example would be, there might be Remote Function module which is being called on a different system.

Process of steps is, go to transaction ST01 and check the Authorization Check check box and click on Trace On button(As Shown below).


We do have an option to restirct the trace by User, Program or Transaction using the General Filters button. If there are no filters, this transaction runs wide open for all the users and transactions in that system.

After activating the trace, perform your process steps then come back to ST01 and click on Trace Off Button and then click on the Analysis button to display the trace. Output of the trace looks like the screen show shown below,


In the above screen shot you can usee that, S_DEVELOP check was successful with RC(Return Code) as 0 and S_PB_PAGE has failed with return code 12, so to get access to that transaction, S_PB_PAGE needs to be added to that user's profile.

I will try to post another blog about Authorization Objects and sap transaction code SUIM but this is it for now :). Hope this helps you to solve some of the critical issues on your system :).


Friday, August 17, 2012

SAP GUI Issues - Inconsistency check tool


In my experience with SAP, I came across lot of issues for which everything looks fine on the development side but the report does not work properly for few users.

If you come across any strange issues or issues which appear only for few SAP users, then its mostly related to SAP GUI which is used to log on to SAP.

I have listed few issues below which users might face if the GUI installation was not proper,

  1. When you open any transaction on SAP and it dumps with program name being SAPFGUICNTL, SAPLOLEA or any SAP*GUI* or SAP*OLE* related report, then that dump is related to GUI issues.
  2. Issues/Dumps with ALV reports - If ALV's dump or look weird for particular users, then that is an issue with GUI. ALV's interact with our front end to execute few API's, if the GUI is not installed properly then the ALV's may not work.
  3. Issues HTML output reports.
  4. Issues on Graphical output reports.
  5. Issues with ECL Viewer which is delivered by SAP for viewing engineering drawings.
In general, if you come to a scenario where it works fine in few machines fails in few, then that might be mostly related to GUI version.

Basically, when you install SAP GUI, it installs lots of components related to features which you might be used on your SAP system. Best Ex, is ALV, when you click on DOWNLOAD to desktop button on an ALV output, SAP has to interact with your desktop to save the file onto the desktop.

Now, to check if that is really a GUI related issue or not, SAP has provided with few tools/techniques which can be used to detect the issue. SAP Note 1099439 illustrates all the techniques provided by SAP. In this blog, I have listed one of the simplest method which is,

Once you log on to SAP, you will see a button on the top right side for customizing our layout, click on that and then on Options,


On the next pop-up, on the left tree, click on the last node which is System Information.


Here, you should see the button which says CHECK SAP GUI INSTALLATION, once you click on that SAP will check your GUI installation to check if any of the components are installed incorrectly or if any components are missing.


Tuesday, August 7, 2012

Creating View Cluster


What is View Cluster?


We all know about Table Maintenance which is providing an option for user to maintain entries in a Z table using transaction SM30.

Suppose if I want to maintain entries in more than one Z tables which are dependent, if we need to maintain each table once using SM30, that is a tedious job and there is quite a good chance of user making mistakes in maintaining these tables. To handle this scenario one of the option which comes to any person working on SAP is, can we write a program which helps me to maintain all the tables at once? Yes, we can, but, there is another option provided by SAP, which is View Cluster.

Even this is something done by a developer there are some pros compared to maintenance transaction, if you are looking for simple functionality of just maintaining entries in table and triggering some process during SAVE/DELETE etc. If you are looking for complex, user friendly or cosmetic kind of features, then YES developing a report is a better option. Main advantage of View Cluster is, its easy to use, easily understandable by person with no technical background, doesn't needed to be changed if we have any changes to tables,

Creating View Cluster:

SE54 is the transaction code for creating View Cluster. This is the same transaction we use for creating Table Maintenance too.

Once you enter into this transaction, on Top you will see a button which says Edit View Cluster, click on that button to navigate to View Cluster create screen.


You will see the below screen, where specify the desired View Cluster Name and click on Create/Change button.


Below screen is the header screen where you can specify the Short Text of the View Cluster and also its attributes.


Here we are creating a simple cluster so, I have selected use in Hierarchy radio button and Complete Radio button.

Once the header maintenance screen is maintained, then click on the Object Structure folder on the left to maintain the actual list of tables you want to be able to maintain using this View Cluster.


View/Table Column - Here we specify the Table/View name which you want to include
DDIC Column - When you click on that it will show the fields of that table
Short Text Column - Specify a description for this Table
Predecessor - This field is used to maintain Header/Child relationship b/w tables.
Dependency - Here we indicate whether it is a Header Table to child table.
Position - Position of the table in the output
Start - At least 1 Table needs to be defined as a Starting point.

Similarly you can add upto 14 tables in a single View Cluster.

Adding Parent/Child Relationship tables:

If we have Header table and Item table to be maintained, then 1 row will be related to Header table and when maintaining Item Table, on its entry maintain Predecessor as Header table, later maintain the field dependencies for both the tables. Below Screen shots explain as how to maintain them,


On the Field-dependence screen,


Once this is complete, Save the Cluster, and then click on Activate on the Header Entry level, that will save and create the view cluster.

Testing:

SM34 is the transaction to maintain entries in View Cluster. For the above demo, final output looks as shown below.


I had 3 tables, 1 is Independent table and 2 dependent tables. Final output shows as below, the description we gave while creating the entries will be shown in the final output too.

Important Transactions:

SE54 - Create/Change View Cluster

SM34 - Maintain data in View Cluster
SE93 - Used to attach Transaction Code to View Cluster.

Friday, June 22, 2012

Basics of Debugging in SAP


Debugging on SAP:

Debugging is one of the best and wonderful tool used by the developer(In any development Environment) to track down a issue and also to understand code or logic written by any other developer.

As we know, since its being a technical stuff, not all Functional Consultants will have an idea about it, so they have some tough time initially to understand as what it is and how it works, but once they understand it, its like piece of cake to any person.

I have put some basic information regarding debugger and some basic concepts about debugger, going over these might help you in not getting panic when you see a debugger screen :).

Note: In SAP, there are 2 types of debuggers. One is Classic debugger and the other one is New Debugger. Classic debugger is lot easy to use and also to understand but New debugger(available from release levels 6.40) is has more features and also will be used vastly in future, so I am going over New debugger in my blog. 

Some brief differences between these 2 types are, (Courtesy of SAP)

  • The Classic Debugger runs in the same roll area as the application to be analyzed (debuggee). It is therefore displayed in the same window as the application. However, this technology also has some restrictions. For example, some ABAP programs (such as conversion exist) cannot be analyzed in debug mode for technical reasons. However, the most significant restriction is that no ABAP technology can be used for designing the Debugger interface and it is therefore not possible to create a modern user interface.
  • The New Debugger on the other hand, is executed in a separate external session (Debugger), while     the application to be analyzed (debuggee) uses a second external session. With this technology, the user interface of the Debugger can be designed freely by ABAP means.


About New Debugger:

SAP's old debugger which is Classic debugger was user-friendly but has some cons as described above. This New Debugger is a lot different to old debugger, just not in look but also in features.

List of few features available on New Debugger are:

1. Ability to Configure the look of the debugger screen.
2. Multiple Desktops options to go over multiple types of data while debugging.
3. Access to all the Global Variables of the report or function module which we are debugging. 
4. Tab Layouts to easily access multiple information which is necessary while debugging. In Classic debugging, to get to some of the information, we have to navigate through Menu Options.
5. Advance features like Saving a test variants to functions modules while debugging, searching for a particular entry inside a table while in debugging, option to get to the updated source code being in debugging mode and few others.
6. More options while debugging Object Oriented code compared to Classic debugger.

Setting up a break-point or starting a debug session:

Option 1:

Program goes to debug mode when you enter /h in command prompt and then execute the report.

Option 2:

In the program place the cursor on a particular point where you want to debug and click on the stop button on the top. When you execute, program will stop here in Debug mode.

Option 3:

Using BREAK-POINT command inside the code. This is mostly used by the developer, if you are not the developer of that report, you cannot use this option.


Difference between the 2 Stop Buttons is, generally for debugging a report we use the one with no human icon on it. STOP icon with human icon on it will be used only for External Debugging, that is if your application is being called from out of SAP's current session. Example cases are:

1. If we are debugging a Webdynpro application which actually runs on an Internet Explorer browser, we use the External Debugging button to put a break-point.
2. If we want to debug any Portal or PI Application Call, we use External Debugger.

This doesn't mean that you cannot use that for normal report debugging, we can set a break-point using this button too for a normal debugging.

Also, for the below screen shots, I have configured my debug screen to show Code on the left part of screen and the variables data on the right part of the screen, Actually this is the standard layout, but you can change this layout to have 4 screens on a layout..

Once you are in Debug Mode,


On the left screen you will see the code and on the right screen you can see the values of the variables at that point of the program. Like, if you see on the right side p_copy variable has value 001 at this point of the program execution.
Here, to debug step by step, we can use the buttons on the top of debugger screen which are,
If you want to go Step-by-Step either click on F5 or click on first button of above.
If you want to execute a complete step(Like a Function Module called in program without going into the function module, click on second button or F6.
F7 is to come out of step. Like you have gone into a function module, now to come out of it without going through the whole logic, use F7.
F8 can be used to come out of debugger and continue execution normally.

Using the above commands you can navigate through each point of the code and keep checking the main variable which you think has an issue or the main variables which are shown in the output of the report.

Important concepts to know while debugging:

1. One of the most helpful and used property of a debugger is, ability to change values of the variable while in debugging. I can explain that in brief in below screen shots:


In the above screen shot, I am inside a Loop of an internal table, one of the field of that table has a value of '01', as shown below


I have some code to check when that value becomes '02'(LI_CNODID_LINE-NODE_ID), suppose I dont have test case for that, what I can do is click on that Pencil Icon next to that field and you will see that field as input enabled and you can change the value of that field to 02 as shown below,


If you see the above screen, that pencil icon changed to DISPLAY icon and the field is input enabled. Once you change the value of that field you can just hit enter and the value gets changed.

Most important point is, you would need authorizations to do that :), most of the functional people will not be provided authorization to do that.

2. Setting up a break-point at a particular ABAP Command or a Statement. - If we know that the program is failing at a particular command, we can use the below option to set the break-point at that particular statement instead of debugging through the whole code.

When you are in debugger mode and if you want to set a break-point at any of abap command you can do it based on the navigation screen shot below.


 On the right part of screen, if you see Tabs which say Variables1, Variables3, Locals and Globals, in that Globals shows the list of values of all the variables used in that program at that point of time.

We have some notes under help.sap.com too about the Classic and the New Debugger. Below is the link for the same.


Wednesday, May 23, 2012

Basis Tricks and Tweaks


Mass Changing Object Directory Entries or Source System of ABAP objects:

In one of my client, they created a new system(XYZ) as a copy of current system(ABC) to upgrade it to latest version of ABAP.

Once the system is upgraded from ABC to XYZ, all the programs need to be changed in the new system. When copying the programs from old system to new system, Source System option needs to be changed from old to new system, otherwise everytime you try to change an object it will pop-up Modification dialog and all the modifications need to be tracked as the object is originated in a different system.

If for any reason, if basis forgets to change the source system when copying the transports, we need to change source system of each object.Instead there is a trick to do it in MASS,

Go to SE03, double click on Change Object Directory Entries button, give the objects for which you want to change the source system,


Once you click on execute, you will see the list of objects based on the selection criteria.


click on the package name and then click on the Select button which will select all the objects under it. Once all the objects are selected, in the command prompt on the top, enter MASS command and hit enter,


once you click on enter, you will see the below pop-uip,


Here enter the new Original system in that field and click on Enter. Once you click on the Green Check, it will change the Source System for all the objects selected.

Thats is, you are done :). Post in SDN which mentioned this solution is,

http://scn.sap.com/thread/648301.

Unlocking Objects in a Transport:

When you assign objects to a transport, those objects gets locked in that transport. So whenever anyone makes changes to those objects, those changes have to be in that same transport unless it is released.

Sometimes we would have to remove locks for certain objects to be able to add them to another transport or when creating transport of copies, due to various other reasons we might want to remove lock for those objects. This cannot be done using SE09 or SE10, this unlocking of objects in a transport is possible only using SE03 transaction code as shown below,

When Objects are locked in a transport, it looks as shown below:


NOTE: Unlocking of Objects is not at all recommended by SAP in standard process, only in some emergency scenarios we might have to do this, so do not do this unless needed.


When you click you will get the tcode where you can give the Tport number of which you want to unlock all the objects,


Once you click on execute, you will get a pop-up as do you want to unlock the transport, just click on Unlock button. Now, when you go back to SE09/SE10 you will see that the objects are no longer locked.


That ends the notes about unlocking objects in a transport.


Thursday, May 10, 2012

Creating Service for a function module


Creating a Webservice for a Function module:

We can create a Webservice for a function module which can then be called directly by any system or application which can accept web service calls.

Take any function module, go to SE37, click on display of that function module.

In the next screen on the top menu,

SAP's wizard to create web service pop-ups where you have to specify the Service definition and also the description.


Click Continue, it will show the Function module name for which we will be creating the webservice, click CONTINUE on this screen too.

Now the next screen is, it will provide option to select Application type and also the Profile. Profile helps to decide the Authentication level of the web service.

Next screen is where is provides the option to select Package and Transport number. Once you click on the Continue button over here, it will create the Webservice from here.

Once the service is created, go to sicf, find the service and activate it.

Also, the service needs to be configured in SOAMANAGER.


Tuesday, May 1, 2012

Debugging Proxy


Debugging Proxy:

Proxy is like a web service call from SAP - PI - 3rd Party. It creates a webservice which can be called directly by any system which is capable of doing that.

Apart from that, we can also use proxy for interaction between SAP - SAP, mostly for synchronous calls. Instead of using RFC's SAP recommends to use proxy if they have PI as a middle ware as there are many advantages of using proxy instead of RFC's.

Steps to create a proxy are explained in a different post, this post is to explain as how to debug a proxy from sproxy transaction.

Step 1: Go to Sproxy transaction and select the appropriate proxy scenario and then click on the execute button on the top.

Execute button is the one on the top left side.

Once you click on that, you get a pop-up where you can select various options to provide the input data. We will be selecting the radio button, Generate Template data and click on execute which will generate test template as how should be the input xml be.


Next screen will the HTML format of the template as how should it look like and also on that screen, there will be button which says XML editor which will allow us to enter data in the xml directly.


Providing the test data: This can be done in many ways.

Option 1 - Manual entry :). I know no one like this option.

Option 2 - If there is already a message sent from Source to PI, then you can go to SXMB_MONI on PI and copy the XML format of the payload and then paste that on to the xml editor. One precaution is, the data on PI will be in HTML view of XML so it might have '-' at the begin of each tag which needs to be removed. Another option, click on the PRETTY PRINTER button on the XML editor which will arrange the tags and you can remove those additional '-' marks. Also, the header tag needs to be adjusted little as per the input format. Easy way to check if the input format is correct or not is, open another session of the same proxy and repeat the steps until where you can see the XML editor. You can compare the tags based on that template which is generated.Also, there is Syntax check button on the top.

Option 3: This is a similar option as 2 but the difference is, I may not have the XML data file on MONI. In that case, you can go to that interface on PI, in the TEST Scenario of mapping, give the data and generate an XML and then come here and give that XML in the data.

Once the data is provided, click on the EXECUTE button with a break-point in the proxy code.

It stops at the break-point and you can debug from there, so its all yours from here :).